
Therbie for Mac
Therbie for Mac runs on macOS 15 or later. It has three jobs:
- It monitors the Mac itself, in the menu bar and in its window.
- It collects your iPhones' and iPads' data. Paired devices send their benchmark results, History and sensor recordings, and Therbie for Mac compares them.
- It runs tests on paired iPhones and iPads over your local network.
The window's sidebar has six pages: This Mac, Devices, Runs & Compare, History, Sensors and Open Data.
Menu bar
Therbie puts a small CPU ring and percentage in the menu bar. Click it for a panel that shows:
- the Mac's name and chip;
- rings for CPU, memory, thermal state and battery (battery only on Macs that have one);
- Low Power Mode, download and upload speed, and GPU load;
- Open Therbie and Quit.
Therbie keeps reading and recording History while it's in the menu bar, even with the window closed. To hide the menu bar item, turn off Show in menu bar in Therbie › Settings….
This Mac
| Card | What it shows |
|---|---|
| CPU | Total load, and a bar per core, grouped into efficiency and performance cores on Apple silicon |
| Memory | App, Wired, Compressed, Cached and Free memory, plus Memory pressure and Swap used |
| Thermal | Normal, Warm, Hot or Critical, with what each means |
| GPU | Live GPU load, plus the chip, GPU cores, Metal family, memory budget per app, unified memory and hardware ray tracing |
| Battery | Level, state (for example Plugged in, not charging), Low Power Mode, and time to full or time remaining |
| Network | Download and upload speed, with the peak over the chart's window |
| Storage | Free space on the startup disk, of the total |
Update interval (the clock button at the top right) sets how often This Mac reads: 1 s, 2 s or 5 s. The default is 2 seconds. In Low Power Mode, or when the Mac is Hot or Critical, Therbie waits at least 10 seconds. The same setting is Update every in Therbie › Settings… (⌘,).
Each card's ⓘ explains its numbers.
Note Macs can show GPU load; iPhones and iPads can't. Therbie doesn't show temperatures or fan speeds on any device: reading them needs hardware access that App Store apps don't get. See What iOS doesn't let apps see.
History
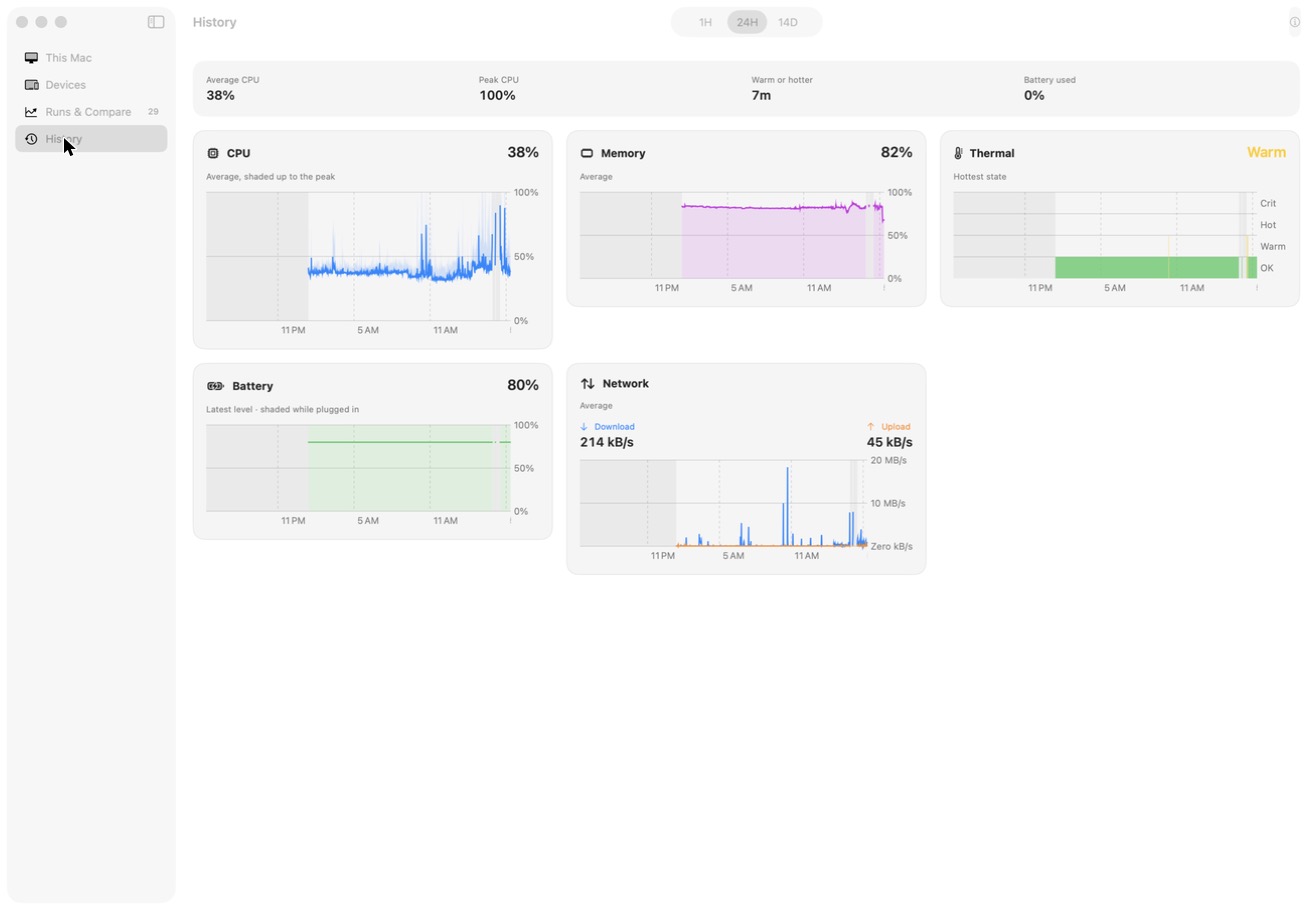
This is the same History as on iPhone, at 1-hour, 24-hour and 14-day ranges, for the Mac itself. Shaded areas are times the Mac was asleep or Therbie wasn't running. See History and Insights.
Runs & Compare
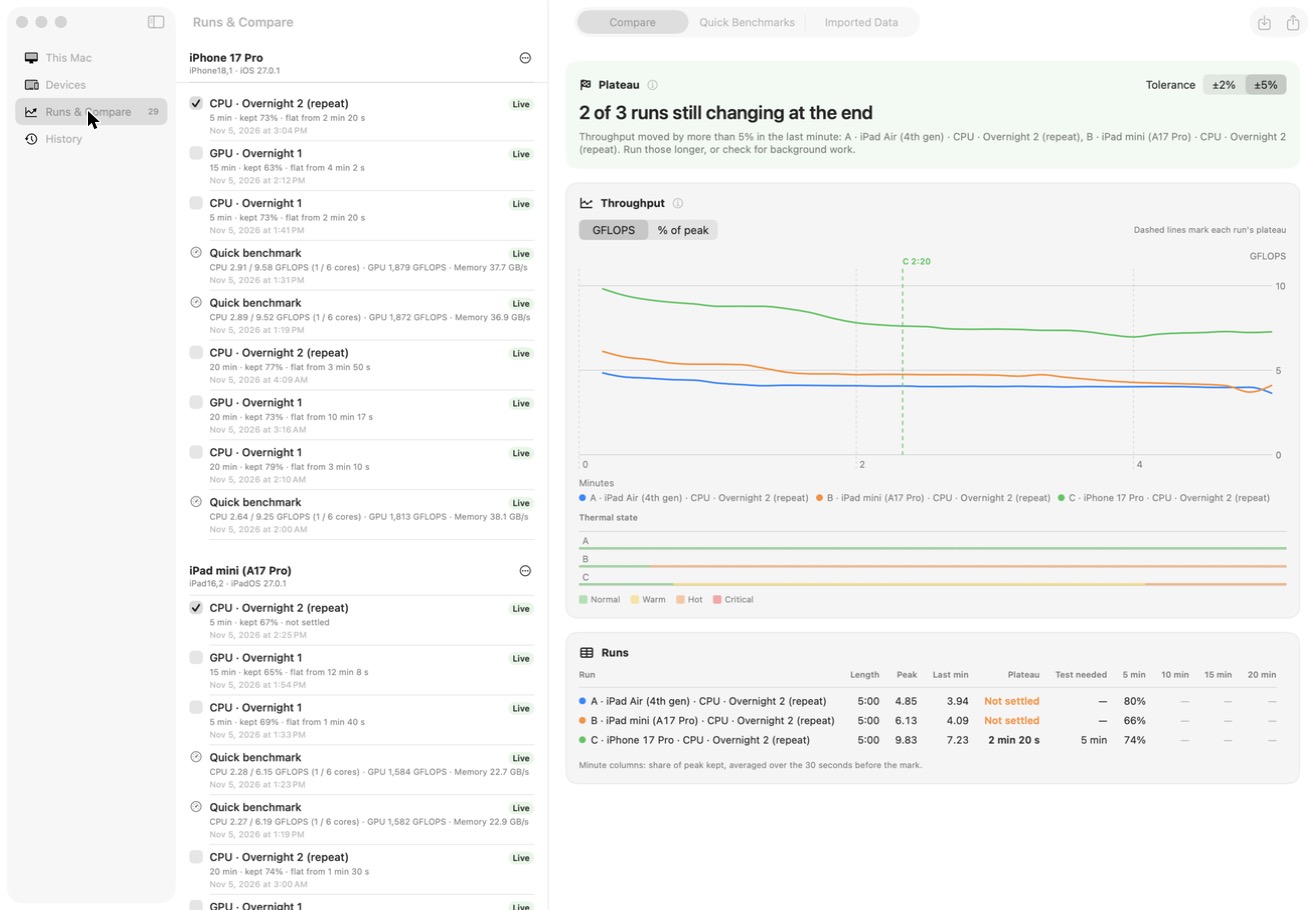
Every benchmark and throttle test that reaches the Mac lands here, grouped by device. Paired devices send theirs by themselves (see Pair your Mac and devices). You can also import files.
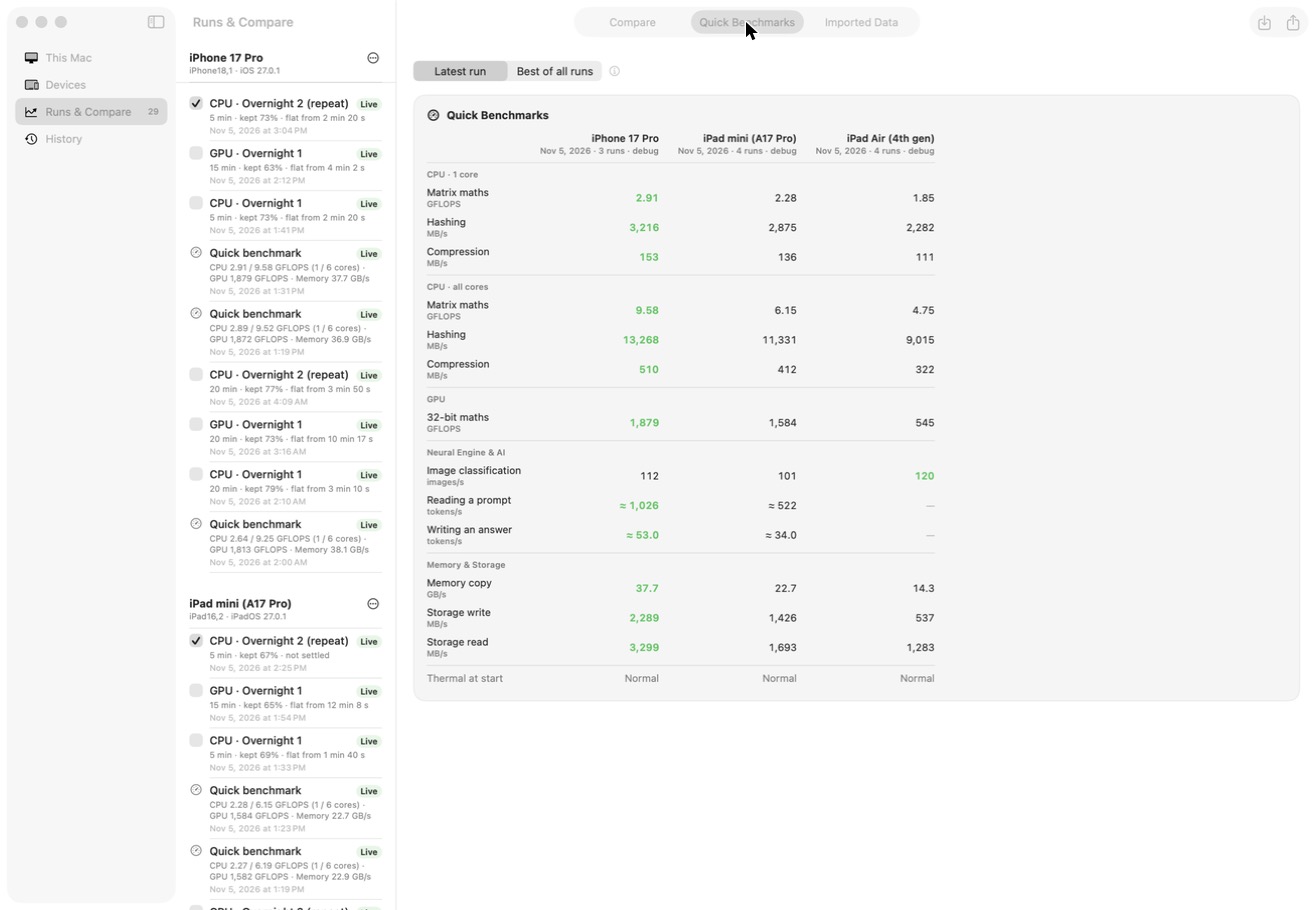
The page has three tabs: Compare, Quick Benchmarks and Imported Data.
- Import: on the iPhone or iPad, tap ⋯ › Export data and send the files to the Mac. Then drag them onto the window, or choose Import Therbie Data… (⌘O) or Import… in the toolbar. History and data usage appear under Imported Data.
- Compare: tick runs to put them on one chart. The table shows each run's peak, where it levelled off, and how much of its peak it kept at 5, 10, 15 and 20 minutes.
- Plateau: where a run stops changing. Choose a Tolerance of ±5% (the default, suits most runs) or ±2% (stricter; GPU runs, which wobble, may never settle at it).
- Quick Benchmarks: every device side by side, as Latest run or Best of all runs, with the highest value in each row highlighted.
- Export All… saves everything as one JSON file for your own analysis.
Devices
The Devices page lists iPhones and iPads on your local network that have Allow my Mac to run tests turned on. Pair each one once. After that it shows live readings, and you can start tests on it or run a plan on several at once. See Pair your Mac and devices and Testing devices from your Mac.
Sensors
The Sensors page shows the sensor recordings your paired devices have sent. Choose a Device, then what to Show:
- Trips
- Vibration
- Sound Log
- Plants (from Bluetooth plant sensors)
- Bluetooth (the Bluetooth survey's counts)
Some changes you make here are sent back to the device the next time it connects, such as renaming or deleting a trip. About sensor recordings (the ⓘ button) explains what syncs and the size limits.
Open Data
The Open Data page builds a preview folder on this Mac. The folder holds summaries of your devices' synced sensor data, with privacy filters applied, showing what a public page could contain. Nothing is uploaded.
- Private zones: places your trips often start or end are treated as private zones. Nothing inside them is shown, and where they are is never written to the preview.
- Viewing it: Rebuild Now, Open in Browser and Show in Finder work on the folder.
- Compare with Public Data (only when you click it): downloads Changi airport's weather reports from aviationweather.gov and Singapore's air temperature feed from data.gov.sg. It uses them to compare your devices' barometer and plant-sensor readings. The requests carry no location or identifier; the nearest weather station is picked on the Mac.
Settings
Therbie › Settings… (⌘,) has:
- Open at login;
- Show in menu bar;
- Update every;
- the switch for sharing this Mac's status (see Mac Display);
- Storage.
Under Storage, Keep synced data sets how long the Mac keeps what your devices send: Forever (the default), or 10, 5, 2 or 1 years. Storage also lists how much space each kind of data and each device uses.
Mac Display
The iPhone & iPad Display button in the This Mac toolbar shares the Mac's status with Therbie on your iPhones and iPads. See Mac Display.